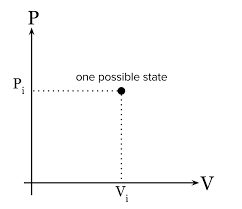
PV-Diagrams chart the change in pressure and volume of some gas as it undergoes some thermodynamic process. They are typically a plot with pressure on the vertical axis and volume on the horizontal. They show transitions from one state ($P_i, V_i$) to another state ($P_f, V_f$).
Here is a video to illustrate an object undergoing non-Uniform Circular Motion.